Reports
The Reports module lets you run queries across any SuiteCRM module and display the results as a table, a chart, or both. Reports can be saved, shared, embedded in homepage dashlets, exported, and scheduled for automatic delivery by email.
Creating a Report
Navigate to the Reports module and click Create Report. Fill in the report fields:
Name |
The report name. |
Report Module |
The primary module the report runs against. This determines which fields and related modules are available in the field tree. Required. |
Description |
Optional description. |
Charts per row |
How many chart panels to display side by side on the report Detail View. Default: 2. |
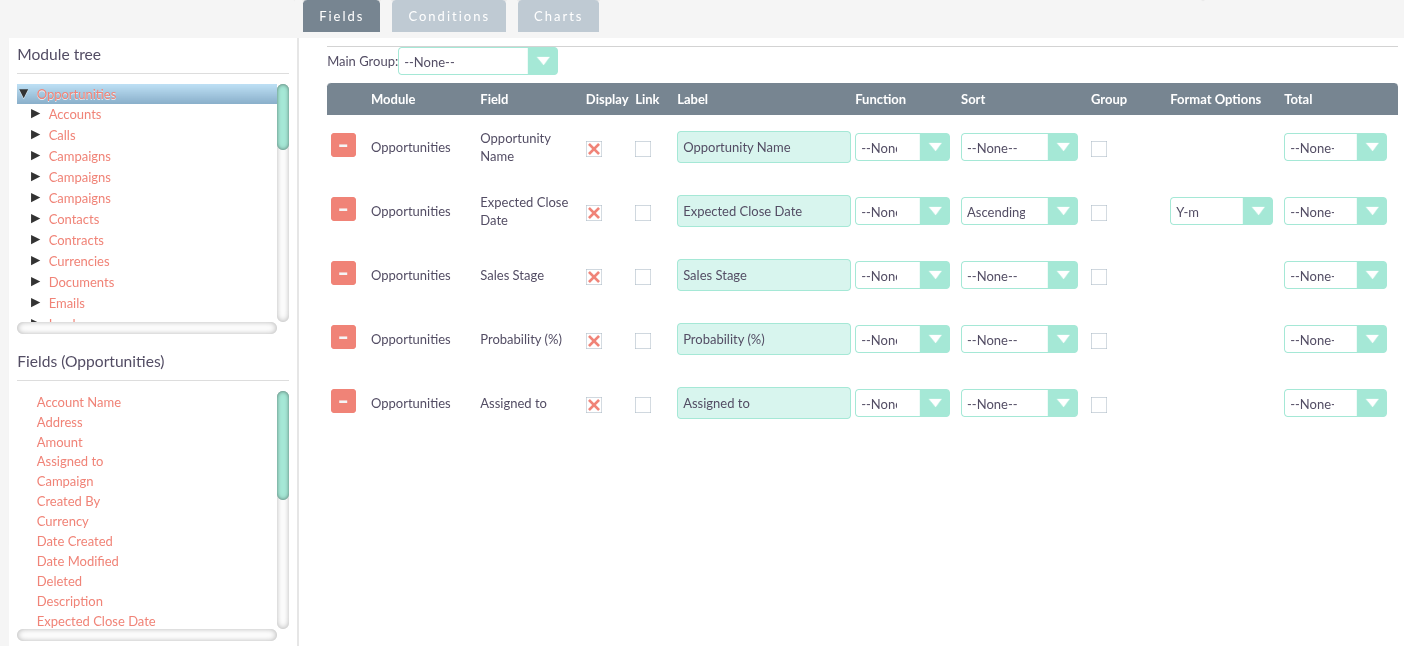
Display Fields
Fields are added by expanding the module tree in the left panel and dragging fields into the Display Fields section. Related module fields are also available — expand the relationship to access them.
Each field added to the report can be configured with the following options:
Display |
Whether this field appears as a column in the report output. Set to No to use a field for sorting or grouping without showing it. |
Link |
Makes the field value a clickable link to that record’s Detail View. |
Label |
Custom column heading. Defaults to the field’s standard module label. |
Function |
Aggregate function applied when grouping: COUNT, MIN, MAX, SUM, or AVG. For example, use SUM on Opportunity Amount grouped by Sales Stage to total opportunities at each stage. |
Sort |
Sort direction for this column: Ascending or Descending. |
Sort Order |
Priority when sorting by multiple fields — 1 is highest priority. |
Group |
Groups results by this field’s value (equivalent to GROUP BY). Use with Function to produce summary reports. |
Group Order |
Priority when grouping by multiple fields. |
Format |
Date display format for date and datetime fields — for example, Y-m-d or d/m/Y. |
Total |
Footer total shown below the results table: COUNT, SUM, or AVG. |
Conditions
Fields are dragged into the Conditions section from the same module tree. Each condition row filters the report results.
Each row configures:
Operator |
The comparison to apply: Equal To, Not Equal To, Greater Than, Less Than, Greater Than or Equal To, Less Than or Equal To, Contains, Starts With, Ends With. |
Value Type |
How the comparison value is specified: * Value: a static value entered directly * Field: compare against another field on the same record * Date: a calculated date offset (e.g. today minus 7 days), defined by a number, a period (minutes/hours/days/weeks/months), and +/− direction * Multi: match any one of a selected set of values * Period: a named date range (e.g. the last 30 days) * Current User: automatically filters to the ID of the currently logged-in user; useful for "my records" reports |
AND / OR |
Logic operator joining this condition to the next row. |
Use the Drop parenthesis button to add parentheses around groups of conditions, controlling how AND/OR logic is evaluated.
Charts
Click Add chart below the Conditions section to add a chart to the report. Multiple charts can be added.
Title |
The chart title, shown on the Detail View and in chart dashlets. |
Type |
Bar, Line, Pie, Radar, Stacked Bar, or Grouped Bar. |
X Axis |
The display field to use on the horizontal axis. |
Y Axis |
The display field to use on the vertical axis. |
Charts appear below the results table on the Report Detail View. The Charts per row field on the report controls how many are shown side by side.
Viewing Report Results
From the Report Detail View, in addition to Edit, Duplicate, and Delete, three output actions are available:
-
Export: downloads the report results as a CSV file.
-
Download PDF: downloads the results as a PDF, including any charts.
-
Add To Target List: adds every record returned by the report to a Target List (Prospect List) for use in a Campaign.
Export and Add To Target List are subject to the user’s export permissions.
Reports Dashlets
A report can be embedded on your homepage as a dashlet:
-
Add a Reports dashlet from the dashlet selector (see Dashboards and Dashlets).
-
Click the pencil icon to edit the dashlet and select which report to display.
-
To show only a chart rather than the full results table, enable Only use charts in the dashlet settings and select the chart to display.
Multiple Report dashlets can be added, each showing a different report or chart.
Scheduled Reports
To run a report automatically and email the results, see Scheduled Reports.