Spots
This module allows you to quickly present these systems in the form of summary tables or graphs.
Create a Spot
-
In the module menu, select Create bulletin.
-
Fill out the basic information:
- Spots
-
The name of the Spot being created.
- Scope of analysis
-
Select the data area on which the summary will be based. The proposed list items can be presented as a specific module (for example, Preliminary contacts), or at once by several modules (for example, Events presented by Calls, Meetings and Tasks) and allow you to compile quite complex summary Spots.
- Configuration
-
It is represented by two combo boxes and data fields. In the first combo box, you can choose how to present data in the form of various types of tables or charts. In the second combo box, a function is selected that determines how exactly the selected data will be processed. The list of available fields depends on the selected area of analysis. By moving data fields in the information area of the summary, you can specify which data will be presented in rows and columns of the pivot table (or on the x-axis and ordinate, if the data are presented as a cumulative graph).
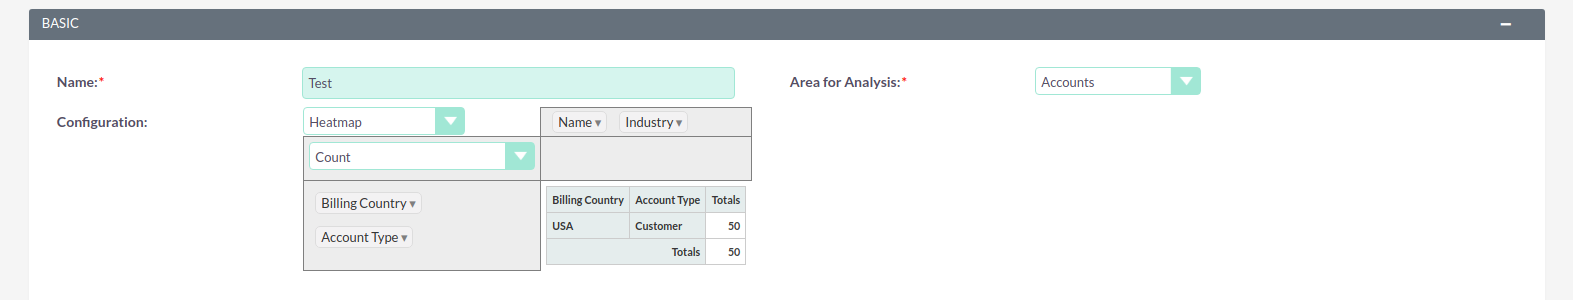
Example:
Suppose you need to view a summary of all contractors entered into the system, taking into account their types and countries of location. For this:
-
In the analysis area, select Accounts.
-
In the configuration, select the field Account type and move it to the header of the future table.
-
In the configuration, select the Country field and move it to the left of the first column of the future table.
-
In the first combo box, specify the method of data presentation, for example, the heat map.
-
In the second combo box, select the function Quantity.
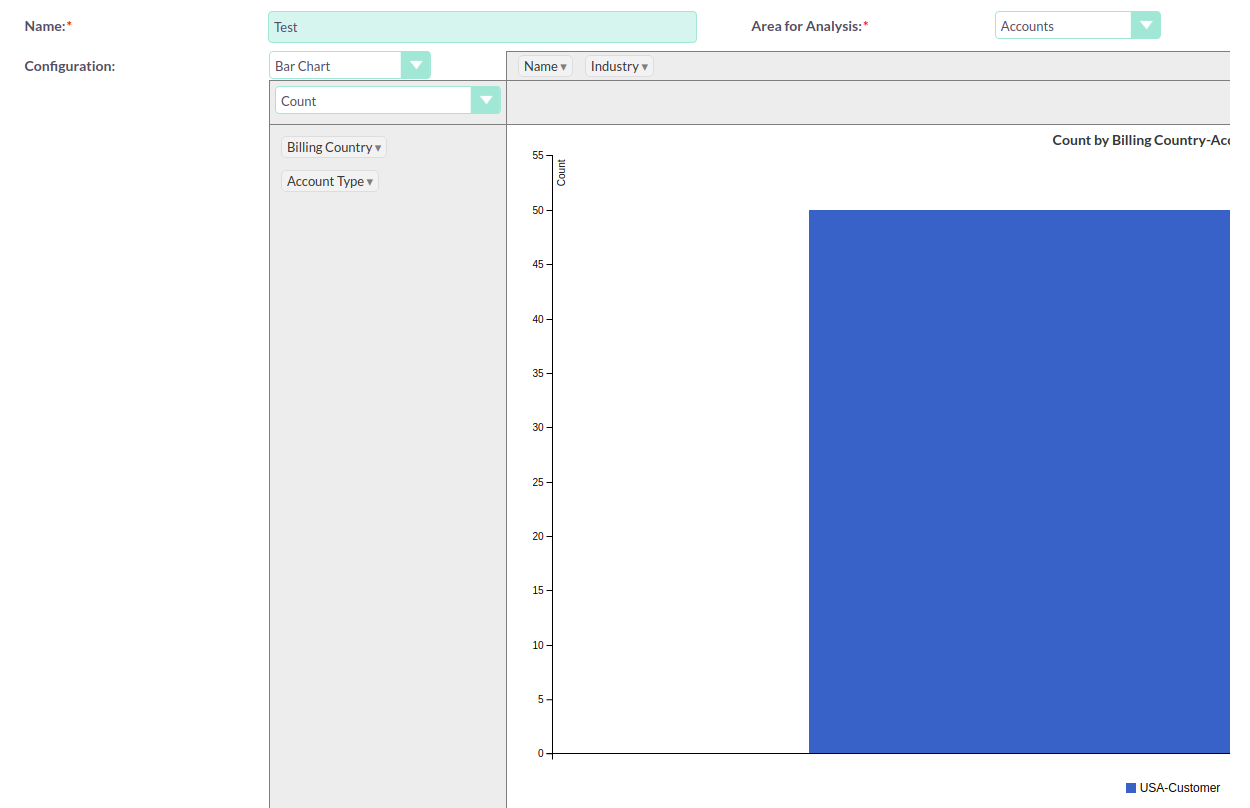
The same data can be presented in the form of a graph, the same summary is shown in the form of a histogram with accumulation:
Displaying dashboard Spots
As well as Spots, Spots can be displayed on the main page in the corresponding dashlet.
The following options are available when configuring the Summary dashlet:
- Title
-
You can enter your dashlet title or leave the default one. Summary: Select the Summary that will be displayed in the dashlet.
- Custom Summary
-
Specify this option if you want to modify the Summary parameters directly from the dashlet.
Manage summary information
In the module you can perform the following actions:
-
To sort the list of records, to do this, click on the icon in the header of the column to be sorted, to click on the icon again, to return the list.
-
Editing or deleting information about several bulletins at once; for this, use the mass update panel.
-
Export records, for this in the menu above the selected records, select Export.
-
View detailed information about the summary, to do this, click on the name of the Spot in the general list.
-
Editing data, for this, either in the View Form, click on the Edit button, or directly in the List Form, click on the button to the left of the record being edited. You can also follow the quick edit.
-
Delete the bulletin, to do this, click on the Delete button.
-
Tracking changes to the entered information, to do this, click on the View change log button in the view form. If it is necessary to change the list of controlled fields in the journal, do it in Studio by setting the Audit of the corresponding field.